The cryptocurrency market is quite mundane following an action-less weekend session. Bitcoin price briefly stepped above $11,000 but immediately corrected towards the key support at $10,500. Investors do not mind the calmness across the market as the last couple of weeks have been nothing but a rollercoaster ride.
As reported by CCN bitcoin price within the two weeks from July 10 shed 18 percent from levels slightly above $13,000 to the current market value at $10,605. Besides, Bitcoin dived to its lowest levels in July almost breaching the $9,000 level. A low formed at $9,080 allowed for a bounce-back above $10,000.
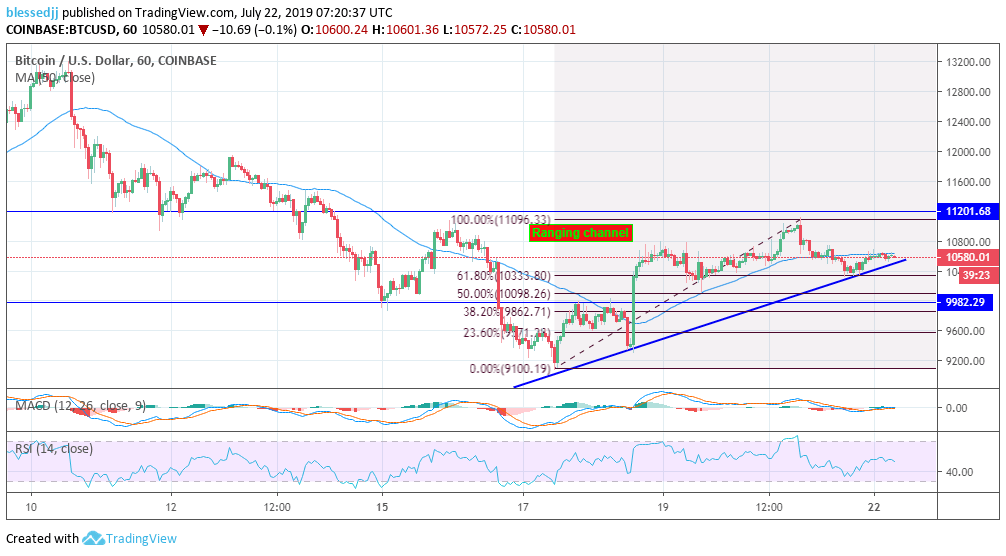
As mentioned above, bitcoin price still lacks the capacity to sustain growth above $11,000. However, looking at the hourly chart for BTC/USD trading pair, a clear upward trend continued to form from the support at $9,000. The immediate upside is limited by the 50 Simple Moving Average (SMA) 1-hour currently at $10,645.
The slide from yesterday’s high at $11,096 found balance at a confluence formed by the 100 SMA 1-h and the 61.8% Fibonacci retracement level taken between the last swing high of $11,096 to a swing low of $9,080.
Bitcoin price technical picture
At the time of writing, a weak bullish momentum is building above $10,600. A correction above the mentioned 50 SMA will face more hurdles around $10,700 – $10,800. Trading above these levels could relaunch bitcoin price above $11,000.
In addition to that, there is a connecting bullish trend line currently establishing support close to $10,450. If a break occurs under this trendline, expect the move to open the way for declines heading towards $10,000 in the coming sessions.

The technical chart shows that bitcoin will continue to struggle with the resistance at $10,800. The Moving Average Convergence Divergence (MACD) has zero divergences after sliding from levels around +236. While the Relative Strength Index (RSI) has recovered from levels below 40, the movement towards the overbought is limited with the signal line ranging around 50.
According to Josh Rager, a renowned cryptocurrency trader bitcoin closed the week neutrally with no sudden movements and between key primary support and resistance levels. He further predicts that there will be some fireworks later this week.
$BTC (mobile view)
Weekly/daily close was neutral
Closed in the range between primary support/resistance levels
But volatility expected to happen this week, BBands starting to pinch on 4 hour
Hopefully we get some live action on the charts to start the week 🎆 pic.twitter.com/ZUdBIdLElg
— Josh Rager 📈 (@Josh_Rager) July 22, 2019
Bitcoin price will range between $10,400 and $10,800 in the coming sessions according to the technical picture. However, we must consider that if a breakout fails to occur above $10,800, there will be a breakdown heading to $10,000 due to buyers’ exhaustion and demoralization. Importantly, the correction to $10,000 will create fresh demand for bitcoin, in turn, giving it a push above $11,000 and beyond.
Click here for a real-time bitcoin price chart.

